Projects
-

School Attendance vs. Test Scores Analysis
Using ORACLE SQL, conducted a comprehensive data analysis on student attendance and academic performance in Math and Reading, using descriptive statistics and correlations to identify key trends, and provided actionable recommendations to improve curricula and operational strategies.
Ensured data integrity and privacy while handling sensitive student information, implementing robust data handling procedures, and maintaining confidentiality throughout the analysis process.
-

Attendance vs. Test Scores Dashboard
Interactive Tableau Dashboard accompanying the exploratory data analysis done on School Attendance vs. Test Scores. Allows user to filter by grade level and scores in Math and Reading.
-

Bespoke Clothing Consultation
I made this dashboard for a Clothing Store in Westport, CT. This business was looking to capitalize on the 25% increase in sales it saw between 2023 & 2024. This interactive dashboard allows them to easily filter in and look at the areas of their company they would like to compare between the past two years. This Project required me to export, clean and merge over 3000 rows of sales data from two different POS systems, Square and Shopify. EXCEL , Tableau
-

Certification Dashboard - Ground Cloud
In this project I combined and cleaned dozens of sheets of data from a company that teaches driver certification courses in the US to create this user friendly and interactive dashboard showing the KPIs for this company’s certifications. This company currently holds a 75% market share on hold against competing vendors due to the quality and expert insights my team provide. SQL, EXCEL, Tableau
-

Mint Classic Cars Analysis
Using Mint Classic Cars data to reorganize the products of warehouses more efficiently and examine the revenue of product lines, SQL, EXCEL
-

Adidas Sales Dasboard
An Interactive Dashboard for adidas sales in the USA using Tableau.
-
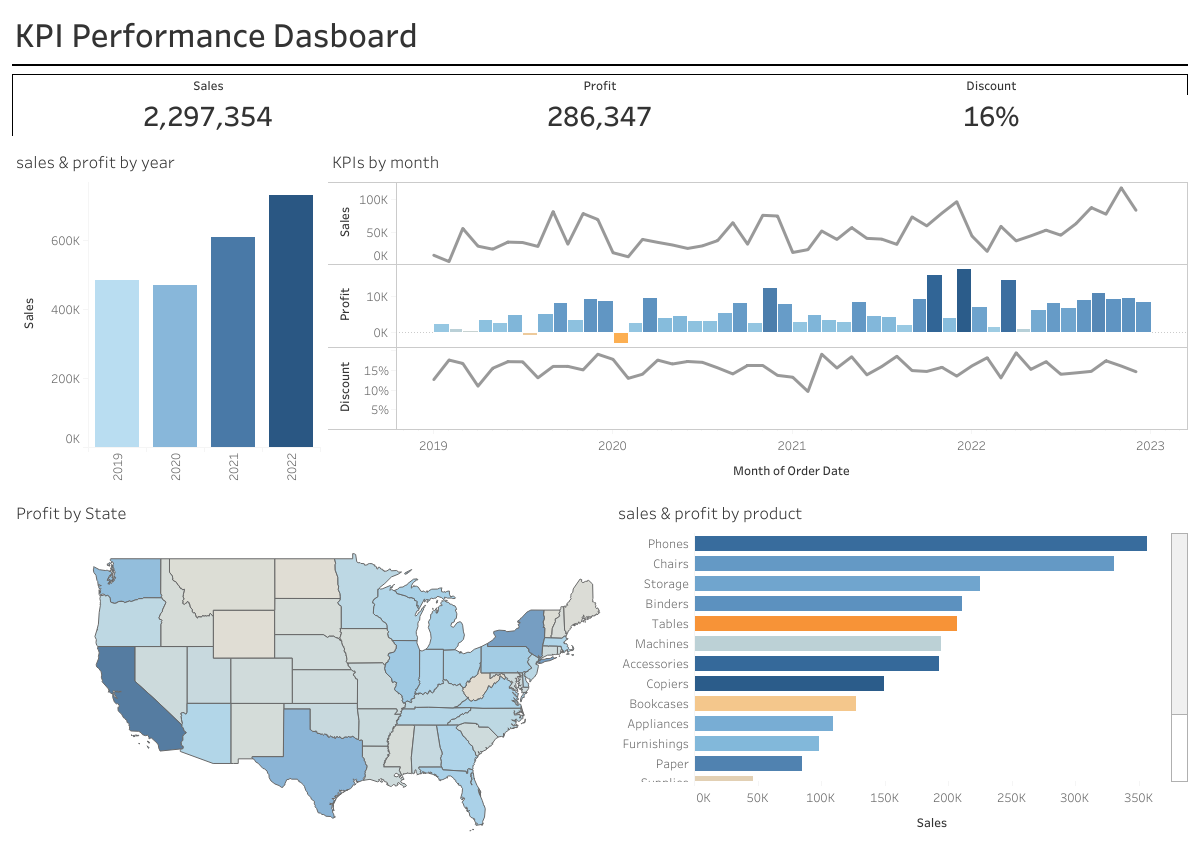
KPI Dasboard
Interactive KPI Dashboard clearly showing the profitable and non profitable areas of a company using Tableau